# Run this cell to import all the necessary libraries.
from datascience import *
import matplotlib.pyplot as plt
import numpy as np
import pandas as pd
%matplotlib inline
plt.style.use("ggplot")
import warnings
warnings.filterwarnings('ignore')
Lab 3: APIs and prompt engineering
What an API is, how the Google Gemini Python SDK works (client, generate_content, contents), and how prompt engineering shapes what you get back.
Goals:
Use the Gemini Python SDK (
client,generate_content) to send prompts from PythonExplore how
contents(strings and lists of strings) shapes what the model returnsPractice prompt engineering (with context vs. without context) for tasks like generating
datascienceplotting code
Setup: You will need a Google Gemini API key from Google AI Studio that Professor Lisa emailed to you this morning! Do not share your key or commit it to git.
Part 1 - APIs and the Gemini SDK
An Application Programming Interface (API) lets programmers use services that other people have written. You often don’t need to know how something is implemented, but only what it does and how to call it.
For example, with NumPy, when you call
np.average, you trust that it returns the mean of the values you pass in—you don’t need the implementation details.
So far in this course, students have already used RESTful APIs (Genius, Wikipedia): you request a URL and get structured data back. Gemini can be used that way too; here we use Google’s Python SDK (Software Development Kit) (google-genai): you build a client object and call methods like generate_content. That pattern is convenient when inputs and outputs are flexible text, and when you make many calls from Python.
Resources:
Ziem et al., Table 1: LLM prompting guidelines (Data 6 Final Project)
[Tutorial] Chat interface to API
Consider the chat prompt shown in the screenshot, as well as (the start of) the model’s response.
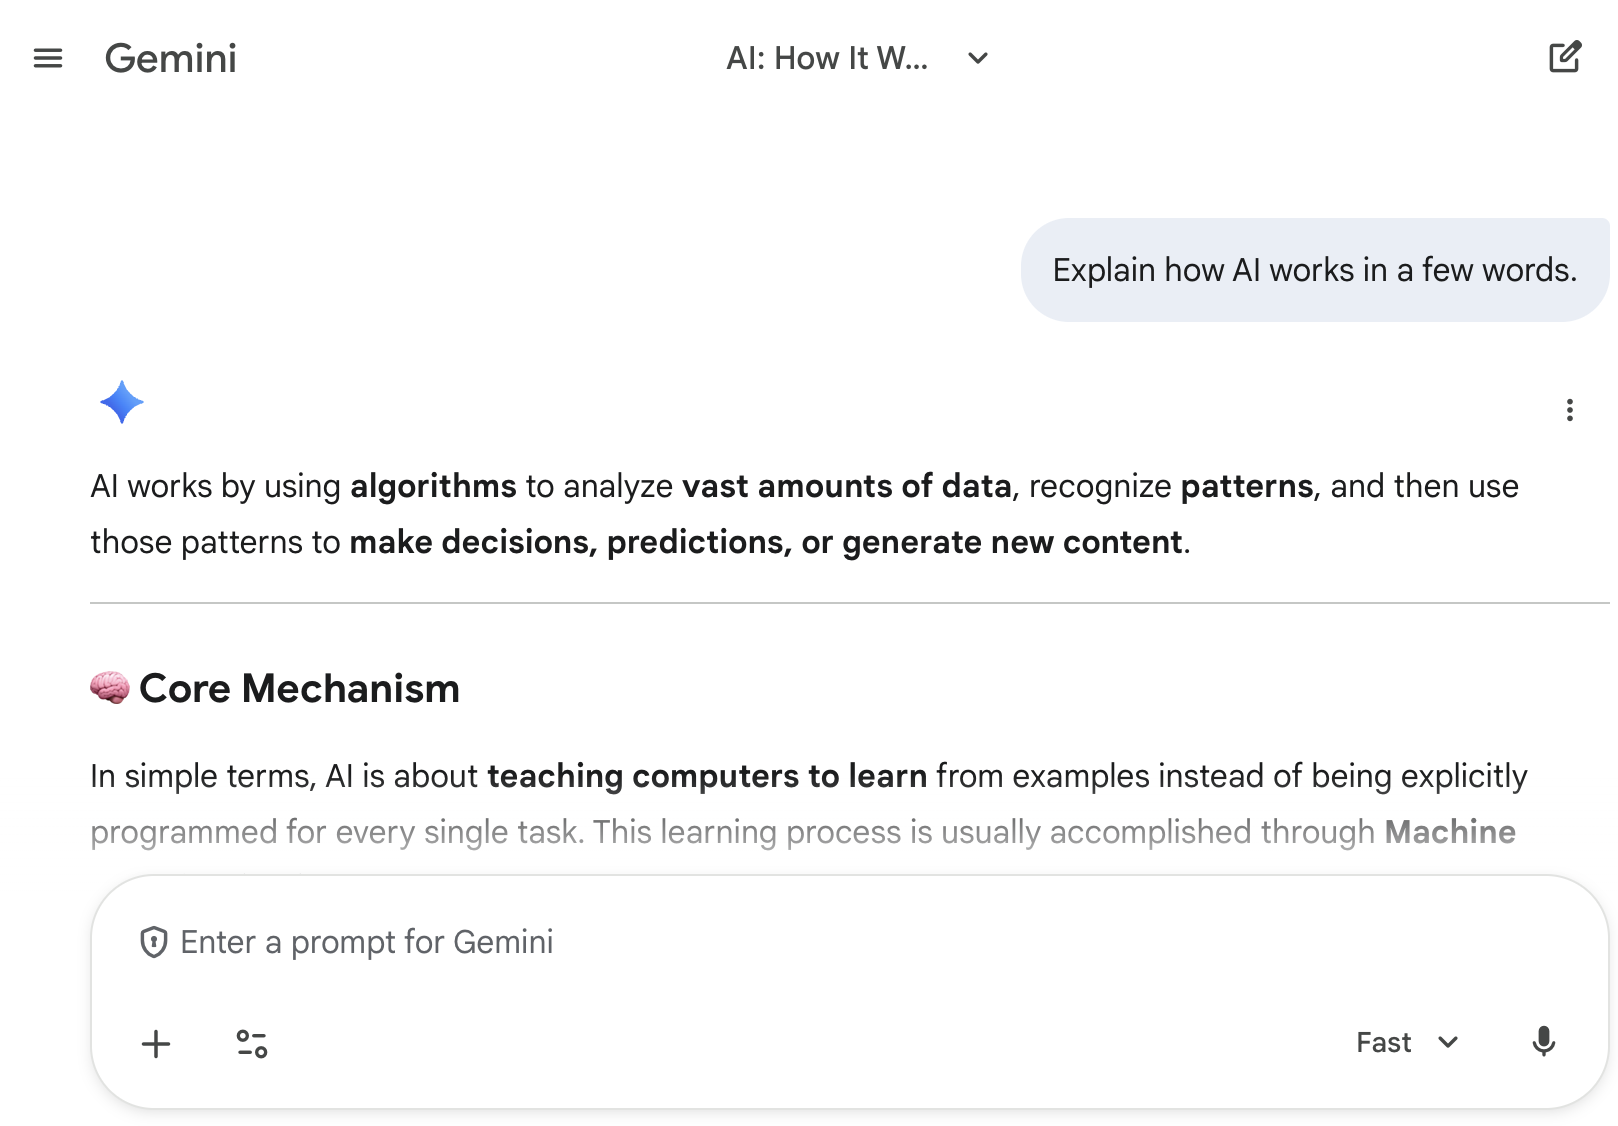
An AI chatbot (shown in the screenshot) is an application on top of a large language model (LLM). The LLM is what takes in user prompts and returns text responses. The chatbot is what filters input, perhaps converting and loading files with additional prompts, and returns filtered LLM responses back, perhaps with some HTML or Markdown formatting.
Let’s break down what is happening in the above screenshot:
The user prompt: “Explain how AI works in a few words.”
The model response: “AI works by using algorithms to analyze...”
The specified model: Here, it is “Fast” (note the dropdown in the bottom right). The other option is “Thinking.” We’ll discuss model choice more below when we call the API.
Gemini: Import
We can also access Google’s Gemini model directly from Jupyter Notebook.
Run the cell below to import the genai module from Google (Gemini).
# just run this cell
from google import genai
Gemini API key
To use an LLM model via an API (e.g., service), we need an API key (e.g., service key). This is usually a pseudorandom string of letters and numbers. Please set GOOGLE_API_KEY key to the API Key in your email that Professor Lisa emailed to you this morning.
Do not share your key or commit it to git.
# replace the "PLEASE_PASTE_YOUR_KEY_HERE" with the key in email
# make sure it is enclosed in quotes (e.g. " ")
GOOGLE_API_KEY = "PLEASE_PASTE_YOUR_KEY_HERE"
What is a string?
A string is a sequence of text characters in Python, written in quotes.
For example "Explain how AI works" or 'Write one sentence.'. Strings are how you represent words, sentences, and other text in code.
Strings in Python are enclosed in single-quotes ('like this') or double-quotes ("like this"). To build Python strings that span multiple lines, we can use the triple quote ("""). Example:
# just run this cell
long_string = """
This
is a ver
y long string
!
hi"""

print(long_string)
[Tutorial] Create Client & Make Request
Run the cell below to make a request and get an LLM response. The structure of making a request:
API client —
genai.Client(api_key=...)is your gateway; its methods expose different API calls.API request —
client.models.generate_contenttakes named arguments:(i)
model: which LLM (here Gemini 2.5 Flash, like the Fast option in the web app).(ii)
contents: the prompt string.
Response —
responseis a Gemini-specific object; for this course we mainly useresponse.text, the model’s answer as a string.
# just run this cell
client = genai.Client(api_key=GOOGLE_API_KEY) #1

response = client.models.generate_content ( #2i
    model="gemini-2.5-flash", #2ii
    contents="Explain how AI works in a few words",
)
print(response.text) #3
[Tutorial] Run the same request again
LLMs are stochastic (i.e. LLMs involve probabilistic randomness), so the wording may change with each and every response.
Run the cell below to call generate_content again with the same prompt. Notice that you do NOT need to recreate the client.
# just run this cell
response = client.models.generate_content(
    model="gemini-2.5-flash",
    contents="Explain how AI works in a few words",
)
print(response.text)
Question 1: Restaurant Suggestions
Replace ... in contents to prompt the LLM to give a restaurant suggestion in Auburn, Alabama (or your favorite city). Then try editing the prompt (different city, budget, cuisine, etc.) to see the difference.
NOTE: Since
contentstake in string data type or list of strings, please make sure to wrap your text in a Python string (" "or' '), e.g.,"Find the best restaurant in Auburn, AL.".
#TODO: replace ... with your prompt
response = client.models.generate_content(
    model="gemini-2.5-flash",
    contents= ...
)
restaurant_str = response.text
print(restaurant_str)
[Optional Tutorial] Different Gemini models
gemini-2.5-flash— fast; use this while iterating on prompts.gemini-2.5-pro— often richer answers; slower and costlier.
Discuss: If you try both on the same prompt, what differs in length, tone, or specificity?
Tip: Prefer Gemini 2.5 Flash while iterating on prompts since it is usually quicker and more cost efficient.
# Optional: same prompt with Pro (may take ~30–90 seconds)
# TODO: replace ... with your prompt in Question 1
response_pro = client.models.generate_content(
    model="gemini-2.5-pro",
    contents= ...  # reuse the same prompt as above in Question 1
)
print(response_pro.text)
Part 2 - Prompt Engineering
[Tutorial] Prompt Contexts
In client.models.generate_content, there are several arguments:
modelargument is a string,contentsargument is a string or a list of strings.response.textis a string
From Wikipedia: Prompt engineering is the process of structuring or crafting a prompt (natural language instruction) in order to produce better outputs from a generative AI model.
Prompt Format
As one structure, we can provide a multi-line string context. Notice the contents part of the API call is now has a multi-line structure. specifying the “character”, “format”, and the “question” itself. The “format” generally follows the question/task to reiterate/stress how important format is to the reply.
client = genai.Client(api_key=GOOGLE_API_KEY) #creating a client

response = client.models.generate_content (
    model="gemini-2.5-flash", #model
    contents= """
    <persona>
    <question/task>
    <format>
    """         #strings containing contexts and question
)
print(response.text)
Run the two cells below:
Build the
contentsstring.Then, make an API request passing in the
contentsstring.
# 1. Build the contents string.
contents = """
Imagine you are an exceptional tour guide who is a local expert talking
to a fellow friend.

What is the best restaurant in Auburn, Alabama? Only include cheap meals
under $15, and only consider restaurants that are open past 9pm.

Format your response as a bulleted list and make sure each sentence
starts in a new line. Limit your response to 100 words.
"""
print(contents)
# 2. Run this cell to make the API request.
response = client.models.generate_content(
model="gemini-2.5-flash",
contents= contents # from step 1
)
print(response.text)How long was Gemini’s response?
# just run this cell
len(response.text.split())
As a further exercise, try removing or adjusting the word limit, then rerun all three cells.
Prompt Engineering: Check your understanding
Recalling Workshop 2
In Workshop 2: Visualization, you created an admit_by_dept_rate table that compute admit_f_by_dept_rate and admit_m_by_dept_rate to the admission percentages (between 0 and 100) of female and males to each department, respectively, using the dataset from the 'UCBerkeley1973_Admission.csv'. Then you used admit_by_dept_rate to create a bar chart visualization in Question 6, which is shown below using admit_by_dept_rate.barh("Major").
# just run this cell to create and show the cal_data table from Workshop 2.
cal_data = Table.read_table('UCBerkeley1973_Admission.csv')
cal_data.show(5)
#Run this cell to recreate the admit_by_dept_rate table from Question 6 Workshop 2. Do not edit this cell.
admit_by_dept = cal_data.where("Admission", "Admitted").pivot('Gender', 'Major')
count_by_dept = cal_data.pivot('Gender', 'Major')
admit_f_by_dept_rate = admit_by_dept.column("F")/count_by_dept.column("F") * 100
admit_m_by_dept_rate = admit_by_dept.column("M")/count_by_dept.column("M") * 100
admit_by_dept_rate = Table().with_columns(
"Major", admit_by_dept.column("Major"),
"F Admit Rate", admit_f_by_dept_rate,
"M Admit Rate", admit_m_by_dept_rate)
admit_by_dept_rate.barh("Major")Converting Table Contents Into Strings
Although we have loaded in cal_data in the previous section, remember that contents in the API call takes in strings data types and cal_data has a data type of a datascience table.
In order to pass in cal_data into contents argument of the API call, we will need to convert the contents in the cal_data table into strings in the next cell.
# Run this cell to convert the contents in the `cal_data` table into strings
with open("UCBerkeley1973_Admission.csv", 'r') as f:
    table_contents = f.read()
Run the three cells below which create
table_contents: string of all the contents incal_datatable_info: definition of the structurecal_datatable, without its contentstable_preview: a preview of the first 20 rows ofcal_data
# just run this cell
table_contents
# just run this cell
table_info = "The table cal_data has three columns: Year, Major, Gender (F or M), Admission (Admitted or Rejected)"
table_info#just run this cell
table_preview = str(cal_data.take(20))
table_preview[Tutorial] num_applicants
In the code cell below, we created an API call that will give the number of total applicants in cal_data using the variables table_contents and table_info that we have defined above.
Notice that now contents is a list of strings. It is okay if some strings in the list are multi-line and others are single-line, as long as they are all strings.
num_applicant_task = "Give me a count of total applicants in the table cal_data. Not code, just the number."
num_applicant_task
# Run this cell to see the result of the API call. It may take a while.
response = client.models.generate_content(
model="gemini-2.5-flash",
contents= [
table_contents,
num_applicant_task,
]
)
print(response.text)Is the LLM right?
# run the cell below to verify the result of the API call
num_applicants = cal_data.num_rows
print("The number of total applicants in the table cal_data is:",
num_applicants)Note: Without context, LLMs will do worse than you expect.
Try running the below cell, which only uses the table structure in table_info and tries to compute the number of rows.
# Run this cell.

response = client.models.generate_content(
    model="gemini-2.5-flash",
    contents= [
        num_applicant_task,
        table_info # no rows! just structure
    ]
)
print(response.text)
When we ran the above request, the model gave us (SQL) code for getting the number (count) of rows. But it was not able to give us the count itself because the model context did not have the data values.
Question 2: num_admitted
Replace ... below in q2_contents that will give the number of admitted students from the table cal_data.
HINT: Remember what the contents argument must be. You may find either table_contents or table_info that we have defined earlier helpful.
#TODO: replace ... with your prompt
q2_contents = """
...
"""
# Do not edit anything below this line
print(q2_contents)
response = client.models.generate_content(
model="gemini-2.5-flash",
contents= q2_contents #from the cell above
)
print(response.text)# run the cell below to verify the result of the API call
num_admitted = cal_data.where("Admission", "Admitted").num_rows
print("The number of admitted students in the table cal_data is:",
num_admitted)[Tutorial] LLM writes plotting code (without contexts)
q_without_context = "Generate a function called paradox_barh that takes cal_data as an input and displays a horizontal bar chart of the admit rates respectively to their gender and major" # Reload so cal_data is a datascience Table (pasted LLM code below may overwrite this name with other types of tables)
output_format = ("Give a complete, runnable Python code only (no truncation with ...) that user can copy and paste into another notebook cell without depending on other cells.",
"Do not add ```python or ``` at the beginning or end of your code.",
"Do not make any assumptions about the data instead make sure you provide all code necessary to run the code without depending on the other cells",
"Do not show me what the provided table is, you are only allowed to just give me the code to make the plot")
response = client.models.generate_content(
model="gemini-2.5-flash",
contents=[
table_info,
q_without_context,
output_format
]
)
print(response.text)Note: It is okay if code pasted from an LLM raises an error.
LLMs do not have full context about your notebook state, installed packages, variable names, or file paths unless you provide that context explicitly. Treat generated code as a draft: run it, inspect errors, and revise prompts or code iteratively.
Press the three dots on the left side of the outputted cell above, select “Copy Cell Output”, and paste the code below:**
#TODO: replace the ... with the code from the LLM
...Hallucination
Hallucination is when the model generates plausible-looking output that is not faithful to the task requirements.
In this activity, hallucination can look like:
using libraries other than
datasciencemaking up random data
returning the wrong function name/signature
using different column labels
making a stacked chart instead of an overlaid chart
adding extra explanation text instead of only code
Why Context Matters
After adding explicit context in the prompt (dataset schema, allowed library, exact function name, exact relabel strings, chart type, and output format constraints), Gemini is much less likely to hallucinate because the solution space is tightly bounded.
So the key lesson is: We did not “make the model smarter”. we made the task specification precise enough that the model can follow it reliably.
Question 3: LLM writes plotting code (with contexts)
Now you will be asking Gemini to write a complete Python function called paradox_barh(cal_data) that reproduces the bar chart above from Simpson’s paradox style admissions data in Workshop 2.
Question: Make sure your question variable includes the following:
Clearly state the function name and its input parameter(s).
Specify what the function should display or return regarding the number of applicants (e.g., an overlaid bar chart).
Mention the dataset columns relevant for the plot (e.g., gender, major).
Indicate the use of overlaid bars (not stacked) with a bar chart.
Model: Please use gemini-2.5-flash
TASK: Please replace ... with your prompt string and model string. Feel free to use table_contents, table_info, or table_preview in contents as additional contexts.
HINT: Expand this cell to see an example sentence for the question and contents variables that correctly generates the plot we want.
question = "Generate a function called paradox_barh that takes cal_data as an input and displays a horizontal bar chart of the admit rates respectively to their gender and major"
model = "gemini-2.5-flash"

w_contexts = """
    - Dataset: The table cal_data has columns Year, Major, Gender (F or M), Admission (Admitted or Rejected) and the data is loaded in for you.
    - You are only allowed to use `.pivot`, `.where`, and `.barh` from the datascience library in your code.
    - Datascience Library details:
     * datascience Table.pivot(columns, rows): the FIRST argument's unique values become column headers; the SECOND argument's unique values become the row labels (the leftmost column).
     * datascience Table.where(column, value): the FIRST argument is the column name and the SECOND argument is the value to filter the table by
     * datascience Table.barh(column): the argument is the column name to display on the horizontal axis.
    - Do not include any other text than the function definition. Do not include texts like comments, etc.
    - Calculate the admission percentages(between 0 and 100) of female and males to each department using the dataset from cal_data.
    - Make sure to store intermediate tables in variables.
    - The values of Gender should be the columns of the pivot table and the values of Majors should be the rows of the pivot table.
    - Make sure that the x-axis is Major, the y-axis is Admit Rate, and the legend is F Admit Rate and M Admit Rate.
    - The function should take in a table and display a horizontal bar chart, and another line of code that passes in cal_data to the function.
    - Make sure the code is where the user can just copy and paste the code into a notebook cell and run it.
    - Do not put any documentation or comments in the code.
    - Do not include ```python or ``` at the beginning or end of your code.
    - Do NOT comment out the last line that calls the function on cal_data.
"""

cal_data = Table.read_table('UCBerkeley1973_Admission.csv') #load the dataset again to ensure it is a datascience table

response = client.models.generate_content(
    model= model,
    contents=[
        question,
        w_contexts,
        table_preview
    ]
)
print(response.text)
question = "..." #TODO: fill in the prompt
model = "..." #TODO: fill in the model name#TODO: fill in the contexts you think are necessary to produce the correct bar graph like the on in Workshop 2
w_contexts = """
...
"""cal_data = Table.read_table('UCBerkeley1973_Admission.csv') #load the dataset again to ensure it is a datascience table
response = client.models.generate_content(
model= model,
contents=[
question,
...,
w_contexts
]
)
print(response.text)Test the model’s code: paste the function into the cell below (or edit that cell until it runs), then run it.
#TODO: copy and paste the code from the LLM to replace ...
# and see if the model correctly made the function that generates the correct bart chart.
...
Compare the model’s code with your code from Workshop 2 below:
admit_by_dept_rate.barh("Major")