Lab 1: Getting to Know Kaggle and Google Sheets
Welcome to the first lab for Data Science Focused for Social Sciences! This lab focuses on introducing Kaggle, a resource for data sets, and how to analyze them using Google Sheets. We will be covering how to navigate through your system to download datasets and upload them into Google Sheets.
To do this lab, you will need a computer with local storage like a hard drive. Before we get started, it is important that you can access to both Kaggle and Google Sheets. You can use the links below to travel to those websites.
Part 1: Accessing Datasets through Kaggle
A dataset is a collection of information or data that data scientists can use to uncover patterns and make predictions. A dataset is very important as we share and store much information in datasets.
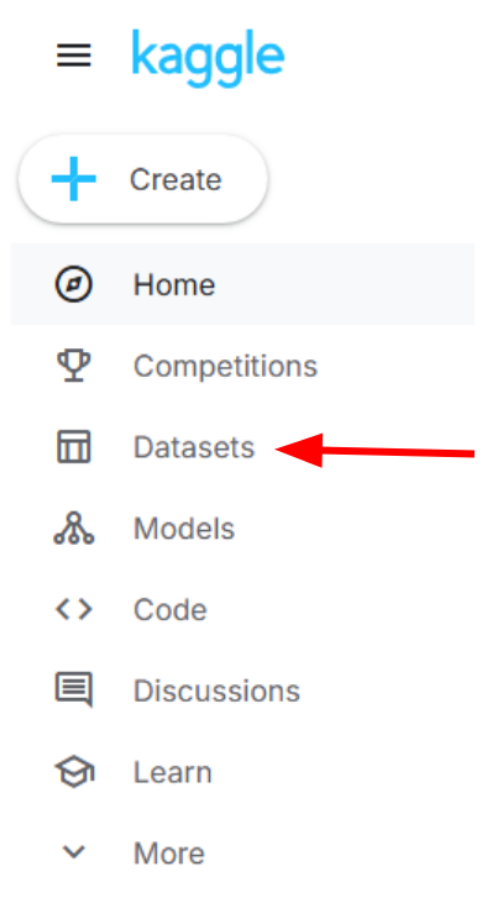
To begin this lab, use the link above to access the Kaggle website. Kaggle is a data science competition platform and online community for data scientists and machine learning practitioners, and it allows users to find and publish datasets. Once you are on the website, you’ll need to create a free Kaggle account. To create an account, look for the “Register” button located on the top right of the website and click it to begin registering. Once an account is registered, locate the datasets tab on the left side of the website.
Dataset tab
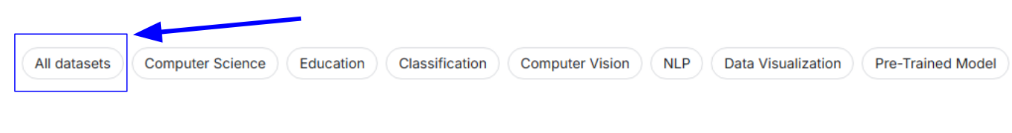
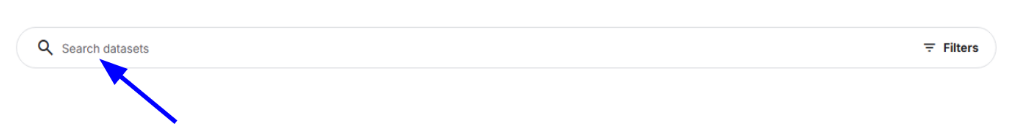
Once you have accessed the datasets tab, you can start searching for all the open source datasets Kaggle has. You can view all datasets Kaggle has by clicking the “All datasets” tab, or you can search for a specific dataset by using the search bar.
All Datasets tab
Search Datasets
You can use either option to start browsing for interesting datasets. Before you start searching for a dataset, there are some size restrictions for the dataset file that need to be considered. Computer files take space in the local storage of your computer, and the unit for digital information is called a byte. The common file sizes that are used are:
Kilobyte (KB) - 1000 bytes
Megabyte (MB) - 1000 KB
Gigabyte (GB) - 1000 MB
Terabyte (TB) - 1000 GB
Besides the size, there are other aspects of a dataset we must be mindful of:
Number of rows
Number of columns
Column Names
Type of data each column contains
This is important because Google Sheets has a 50 MB limit on files you can upload. With this knowledge, find a dataset that interests you and is under 50 MB (preferably closer to 10-15 MB). While searching for a dataset, keep these questions in mind:
What is a question you would like to explore or answer using this dataset?
Think about something you are curious about or a pattern you would like to discover.
What measurement(s) or variables from the dataset would help you answer your question?
Think about the specific columns/types of data you would need
What is an ethical question or consideration related to analysing/using this dataset?
Where does the data come from?
How was the data collected/acquired?
Who benefits from the data collection?
Who might be harmed by the data collection or its use?
Is there consent for data collection?
What was the original purpose for collecting this data?
Once you have chosen a dataset that fits the criteria above, we can then start analyzing the dataset!
Part 2: Learning Kaggle’s User Interface
Most Kaggle datasets include a description explaining their purpose and contents. Once you have a dataset selected, you can start learning more about the dataset.
Understanding Kaggle Datasets
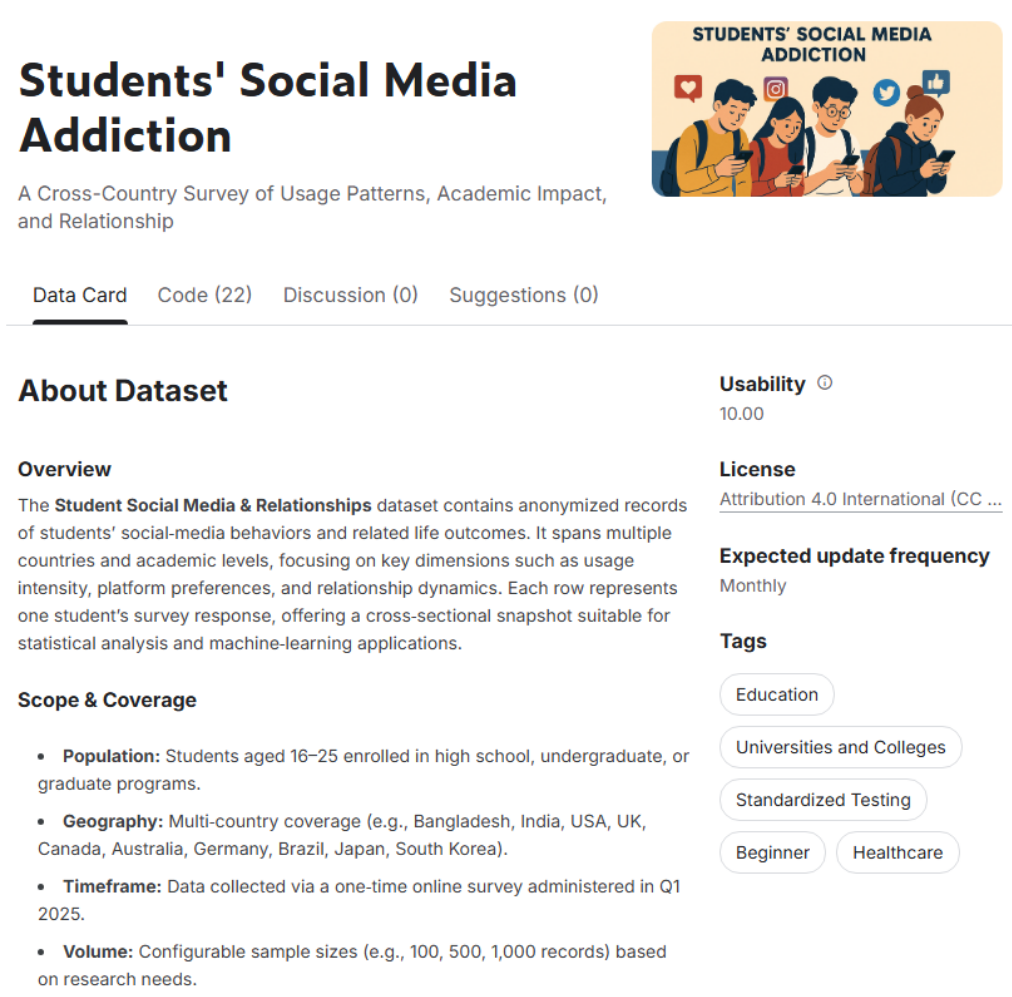
When you have selected a dataset, there is an “About Dataset” section that provides an overview and description of the dataset; scope, data collection methodology, and data quality standards. Here is an example:
Kaggle "About Dataset" example
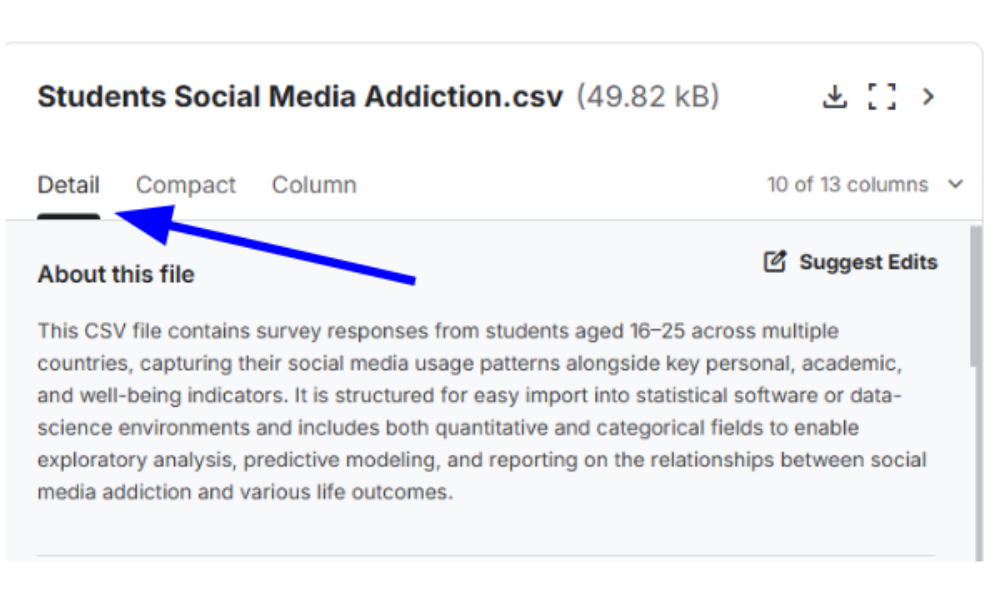
If you scroll down a bit, you will see another tab named “Detail” tab that provides file type and data information.
Detail tab
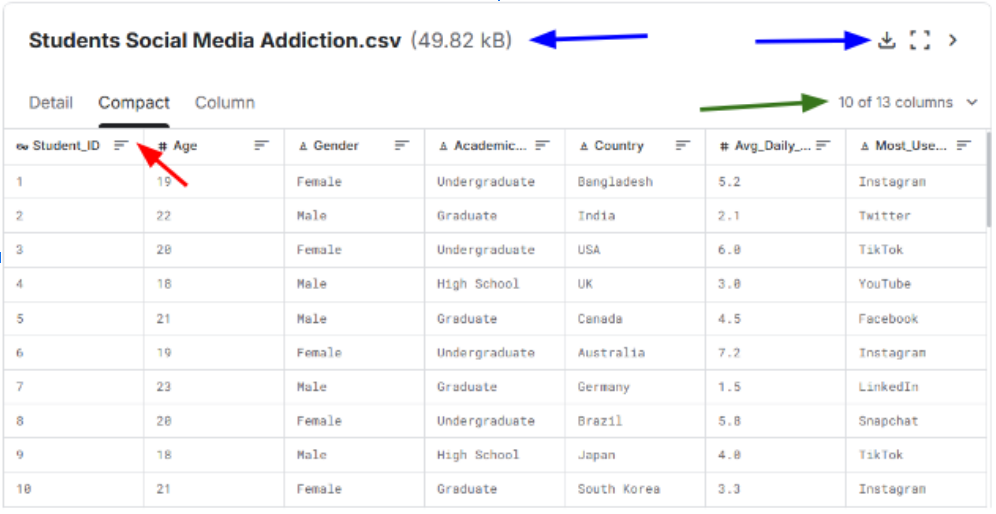
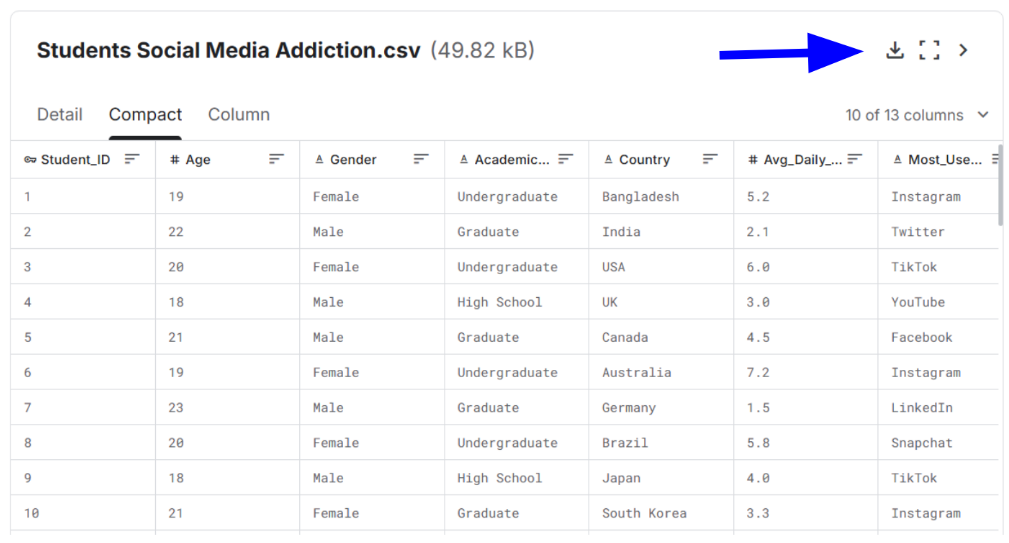
The “Compact” tab provides an overview of the dataset as a relational database.
The left blue arrow describes the size of the dataset, and the right blue arrow shows the download icon for the dataset.
The green arrow points to a dropdown menu that displays the number of columns in the dataset.
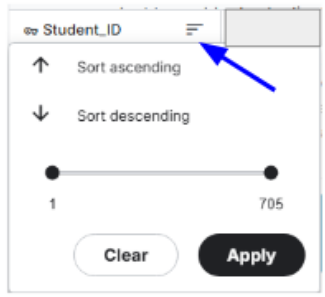
The red arrow points to a drop down menu that allows you to sort the data by ascending/descending order. You can also choose a minimum and maximum value that you want to see in the dataset as well.
Compact tab
Compact Sorting Tab
The “Column” tab provides an overview of each column in the dataset. This tab also notes if the column has valid data (blue arrow) or invalid, mismatched, or missing data (red arrow).
Column tab
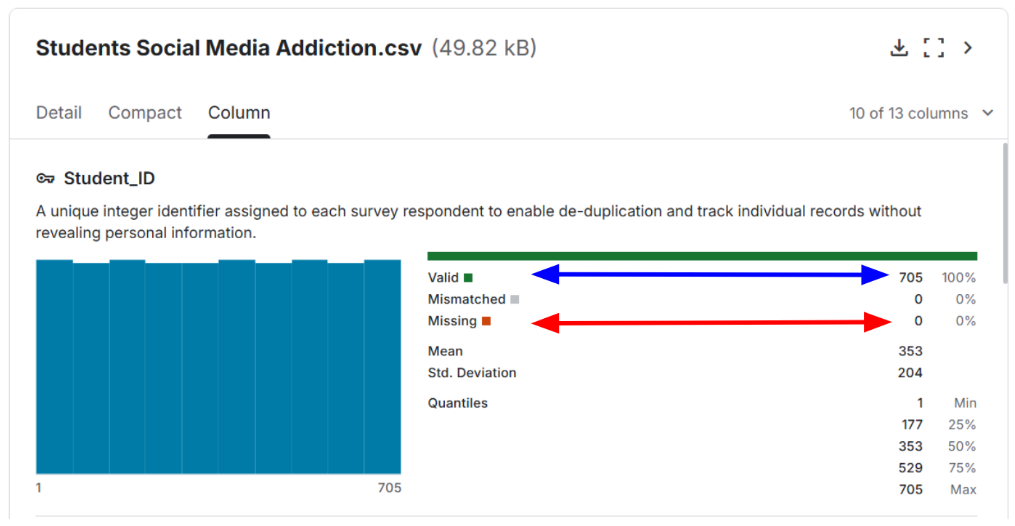
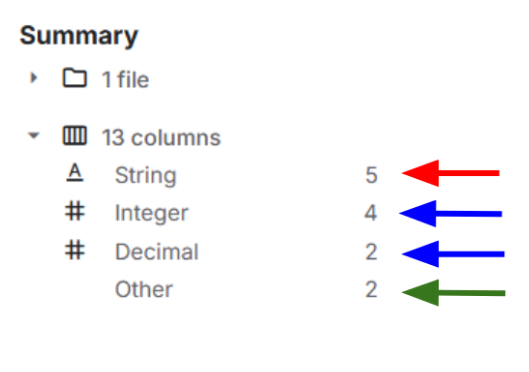
Lastly, there is a summary of the datset’s data type information on the right side of the webpage.
Summary of Dataset
You can learn most aspects of a dataset on Kaggle by looking under these sections for your particular dataset.
Review the Dataset Using the Compact and Column Tabs
Answer the following questions in the textbox following each question:
Type answer here
Type answer here
Type answer here
Type answer here
Type answer here
Type answer here
Type answer here
Analyze the Dataset
Answer the following questions based on what you observe:
Identify two numerical columns and answer the following:
What do these numbers represent?
What range of values do they cover (for example, what are the minimum and maximum values)?
Identify one categorical column and list its unique categories or values.
Type answer here
Consider the following questions:
What story does the dataset seem to tell?
Who might find this data useful, and for what purpose?
Type answer here
Part 3: Downloading and Importing a Dataset into Google Sheets
Once you have found an interesting dataset that satisfies the size criteria, you can download the dataset as a .csv file. To do this, click on the download button pointed out by the blue arrow on the “Compact” tab described in Part 2 of this lab.
Download Button Location
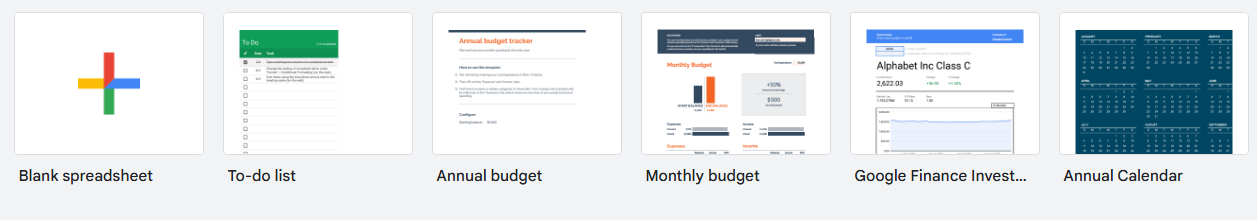
Once you have downloaded the dataset onto your computer, open up Google Sheets from the link at the beginning of the lab. Once you have signed into Google Sheets using your google email, create a blank spreadsheet by clicking on the “Blank spreadsheet” icon located on the top left of the Google Sheets page.
Blank Spreadsheet Location
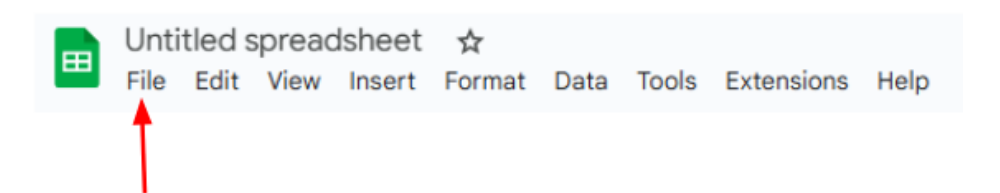
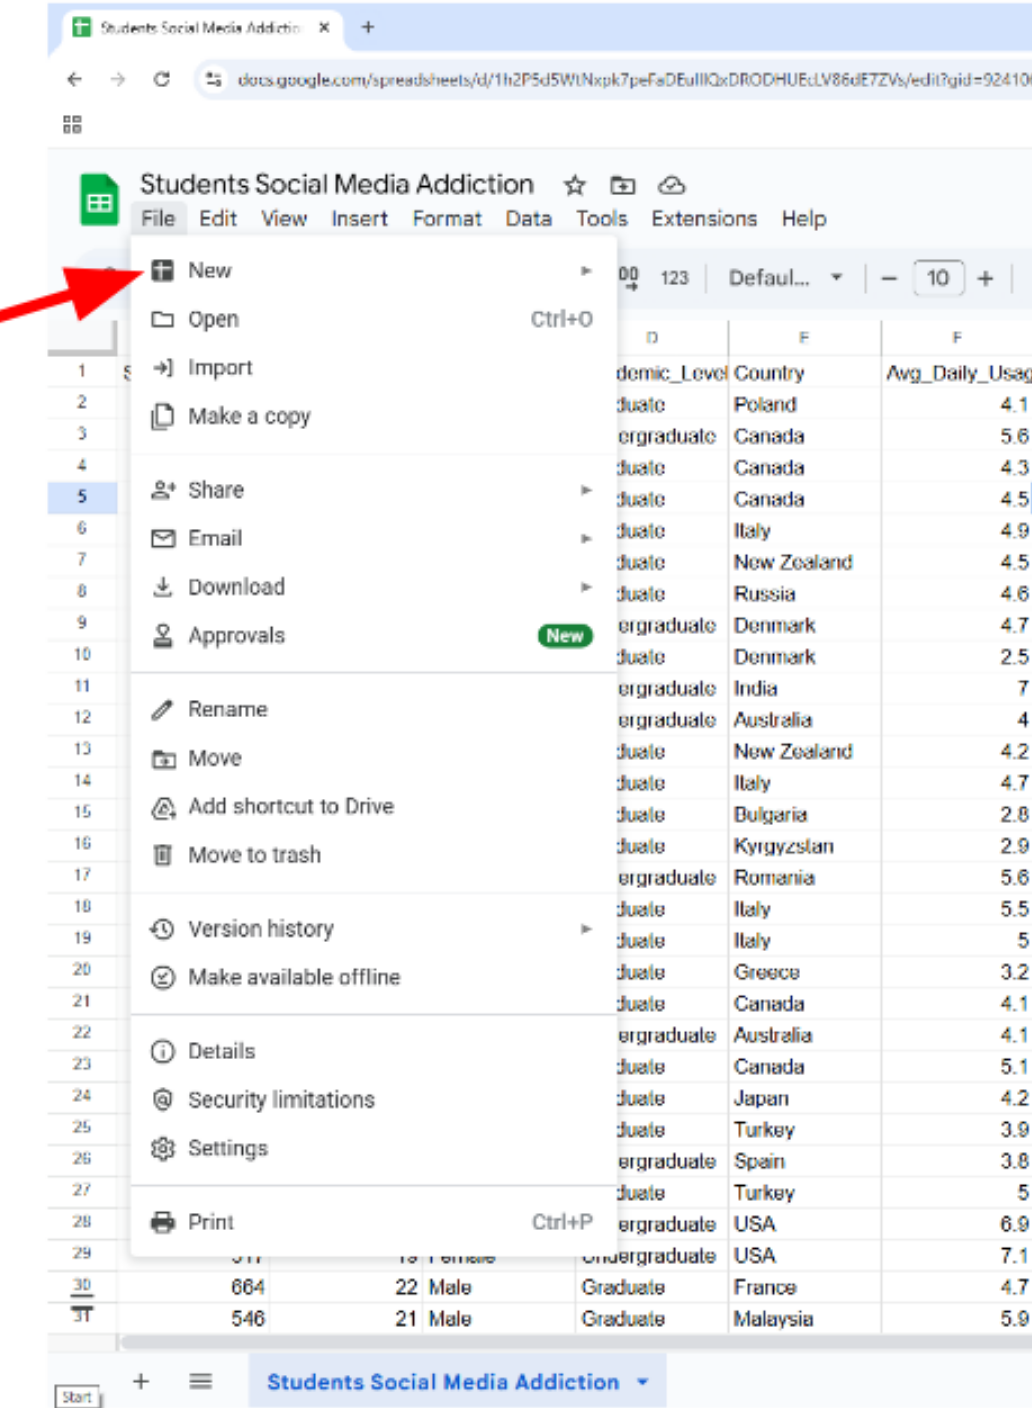
Once you have created a new spreadsheet, you are going to want to import the dataset you downloaded from Kaggle. To do this, first look for the “File” tab in your untitled spreadsheet.
File Tab Location
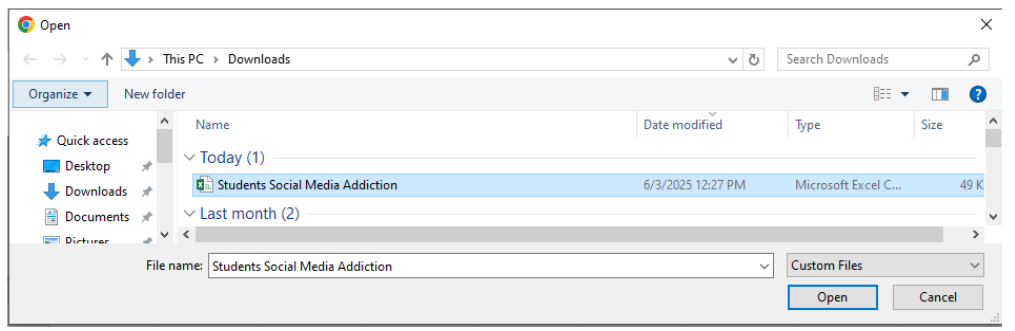
Then, you are going to find the “Open” option under “File”. This will open your computer’s “Downloads” folder for any downloads you have made on your computer. You will want to select the dataset file that you just downloaded to open for the spreadsheet you have just created.
Downloads Folder Example
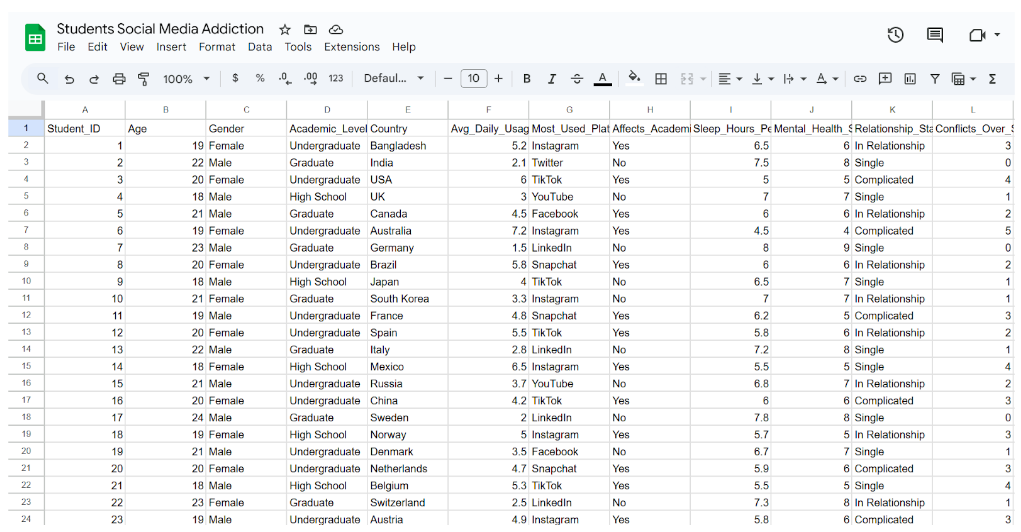
Once you have selected your dataset, your Google Spreadsheet should now be filled with information. Here is an example:
Imported Dataset Example
You have now uploaded a dataset into a Google Spreadsheet! Once you have imported your dataset into Google Spreadsheets, our next step is to create a sample of the big dataset to analyze.
Part 4: Sampling of the Dataset
A sample of a dataset is a partial count or measure of a dataset that is more often used in statistical studies. Normally, population datasets are too big to do analysis on, so we instead take a big enough sample of the dataset to represent the population we are studying.
Creating Random Sample
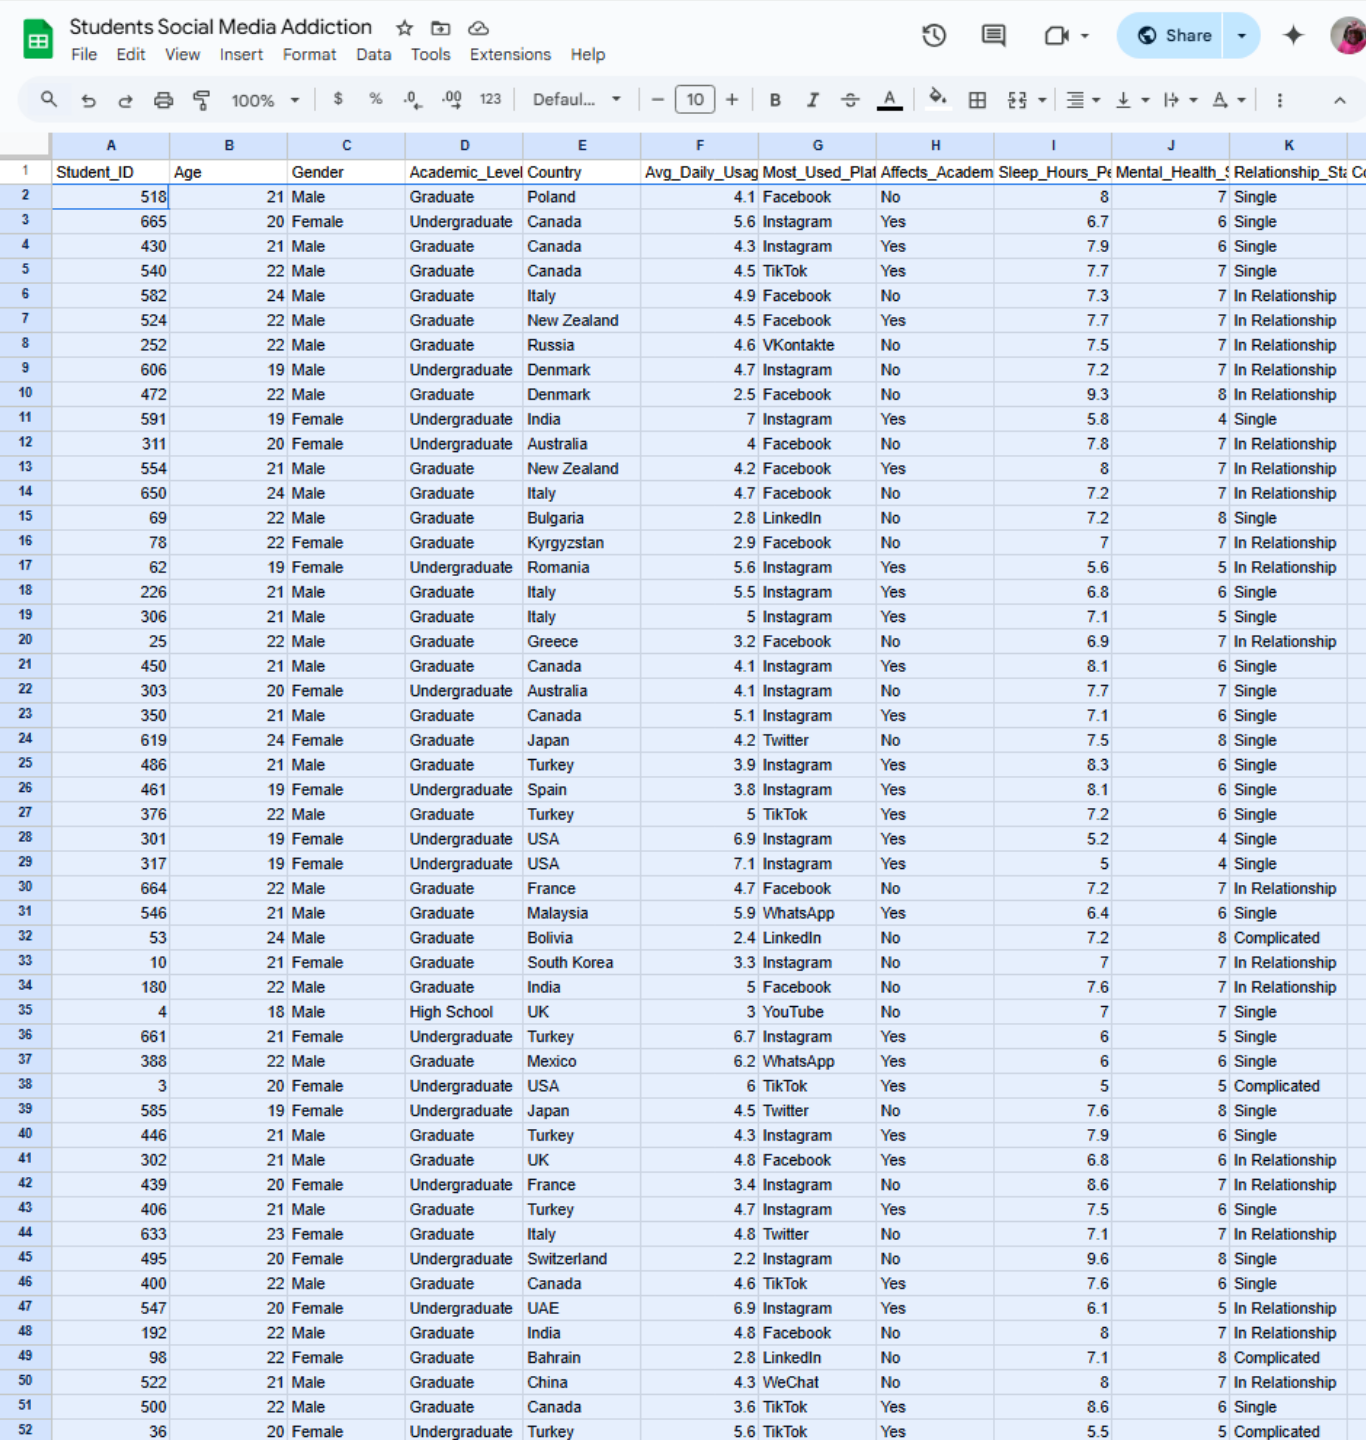
To sample from the dataset you have just imported into Google Sheets, you first need to randomize the rows in the dataset to ensure each data point has an equal chance of being chosen for the sample. To do this, you will need to highlight every row and 10 columns of the dataset in your spreadsheet.
Highlighting All Rows and 10 Columns Example
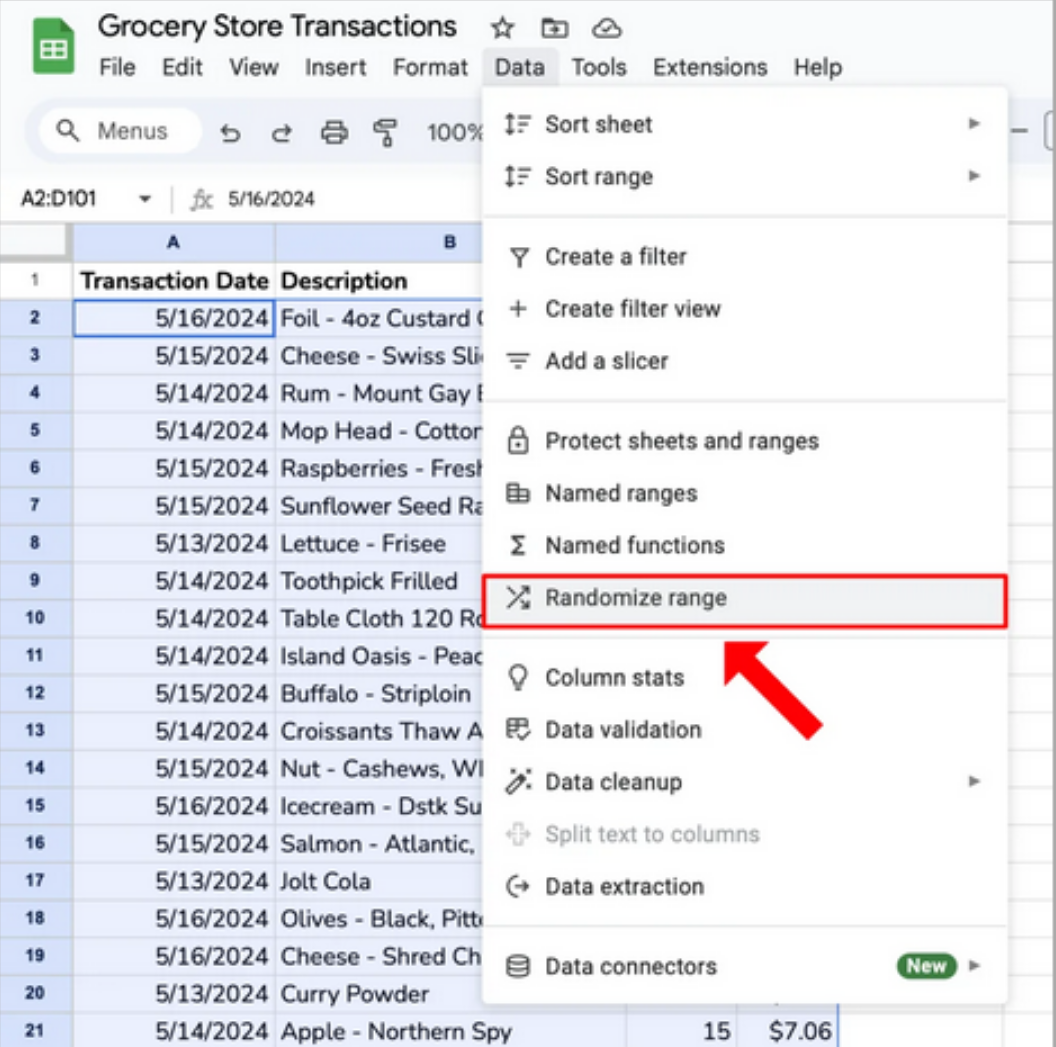
Next, You are going to want to shuffle the rows in your dataset. To do this, click on the “Data” tab and then select the “Randomize range” option.
Shuffling the dataset
Once the dataset is shuffled, you will want to create a new spreadsheet that will contain the sample of the dataset that you just shuffled. To do this, go to the “File” tab and select the “New” option. Then, create a new spreadsheet and name it “Sample - Name of your Dataset”.
Creating Spreadsheet for Sample
Once the new spreadsheet is created, copy over your sample of the dataset you are using. To do this, highlight 101 rows of the newly randomized dataset, including the header row and copy them. Head to your sample spreadsheet and paste the sample into it. Be sure to confirm that your header row and 100 randomized rows and 10 columns are in your sample spreadsheet.
Clean your Dataset
Datasets from Kaggle can potentially contain rows that have missing values. For this lab, we want to ensure the sample of our dataset has no rows or columns with missing values.
Once you have created your sample spreadsheet, please do the following:
Verify you do not have rows or columns with missing values.
Replace any row with missing values with a new row from the randomized database spreadsheet.
Verify data type format by column
Quantitative columns should only have numeric data types
Qualitative / categorical columns should have values algined with the columns values
Replace any row with formatting inconsistencies with a new row from the randomized database spreadsheet
Summarize your Findings
Once your dataset is clean and rid of any missing values or inconsistencies, answer the following questions:
What are 2 questions you would like to explore or answer using this dataset?
Type answer here
Note any interesting patterns or insights you observed.
Type answer here
Type answer here
Type answer here
Create Shareable Link to Sample Spreadsheet
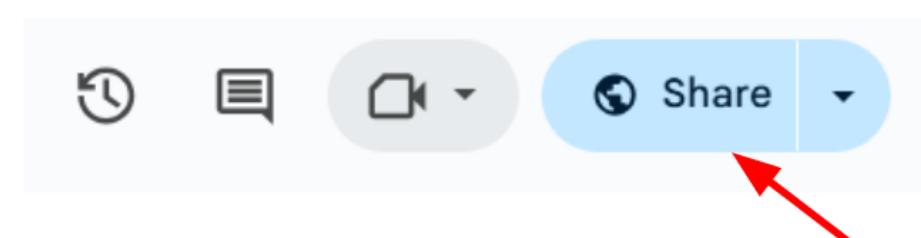
Once you have answered all questions, you are going to want to create a link to your sample spreadsheet. To do this, click the “Share” button on the top right hand corner of your sample spreadsheet
Share button
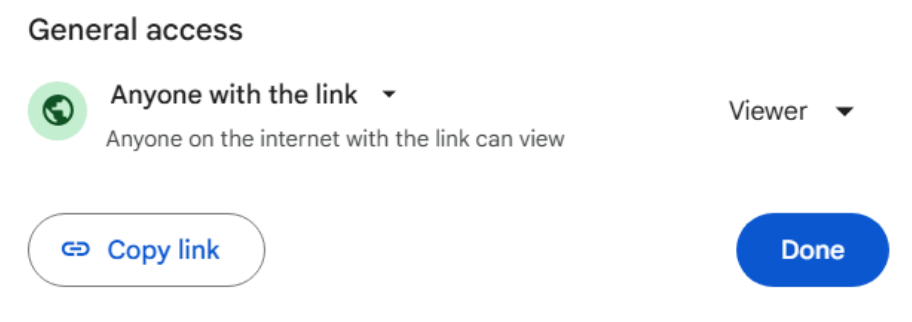
Once you click the share button, there will be a pop up window that has a section called “General access”. You will want to make sure that anyone with the link can be a viewer of your sample spreadsheet, so make sure the button on the right of the “Anyone with the link” section is set to “Viewer”.
Set permission of shareable link to "Viewer"
Once that is done, copy the link and paste it in the textbox below. Make sure that the sheet is viewable by clicking on the link after you have copied it.
Paste link here
And that is the end of Lab 1! The next lab will focus on beginning Python practices and how to use python to analyze your sample spreadsheet!